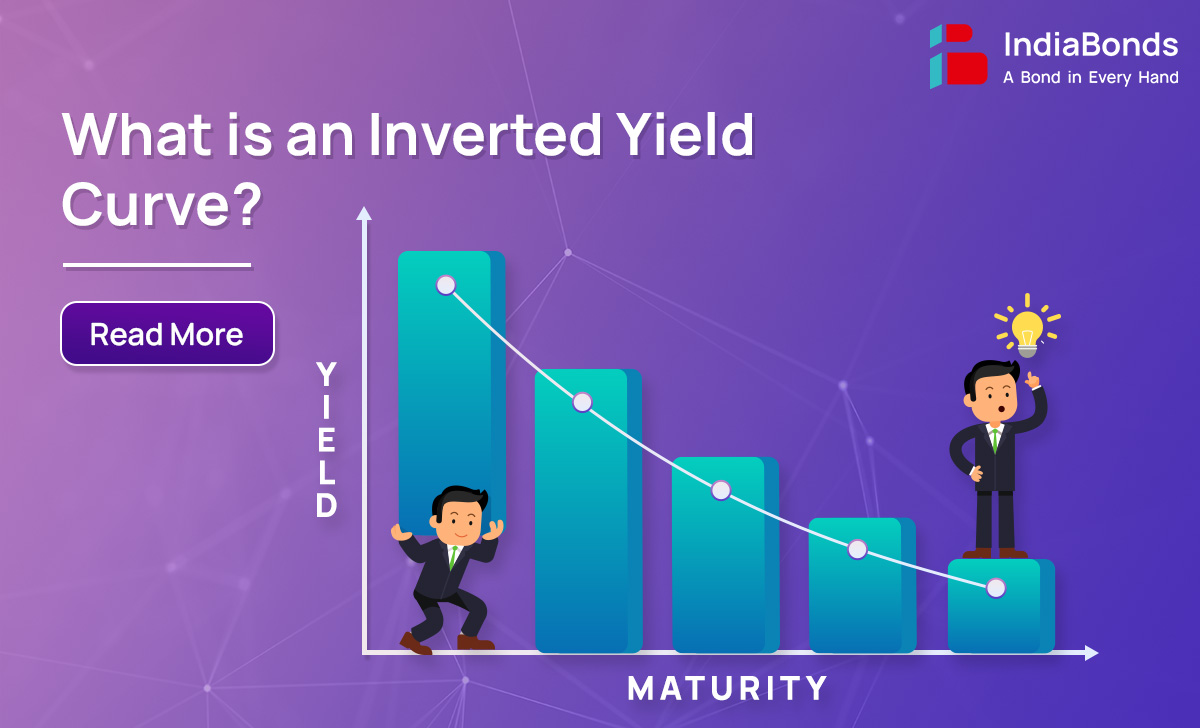


In the world of bond investing, the term “yield” is synonymous with “return.” When referring to the “yield” of a 10-year Government Security (G-Sec), it communicates the 10-year return on that particular bond. The yield curve is a graph that shows the relationship between the yields and the maturity dates of a series of bonds. In other words, it shows how much investors can expect to earn in interest from bonds that mature at different times. For example, let’s say you are considering two bonds: one that matures in 1 year and another that matures in 10 years. The yield on the 1-year bond is 2%, and the yield on the 10-year bond is 6%. If you plot these yields on a graph, with the maturity on the x-axis and the yields on the y-axis, you would see a curve that slopes upward from left to right. This upward-sloping curve is called a normal yield curve, and it indicates that investors expect to earn a higher return on a longer-term bond.
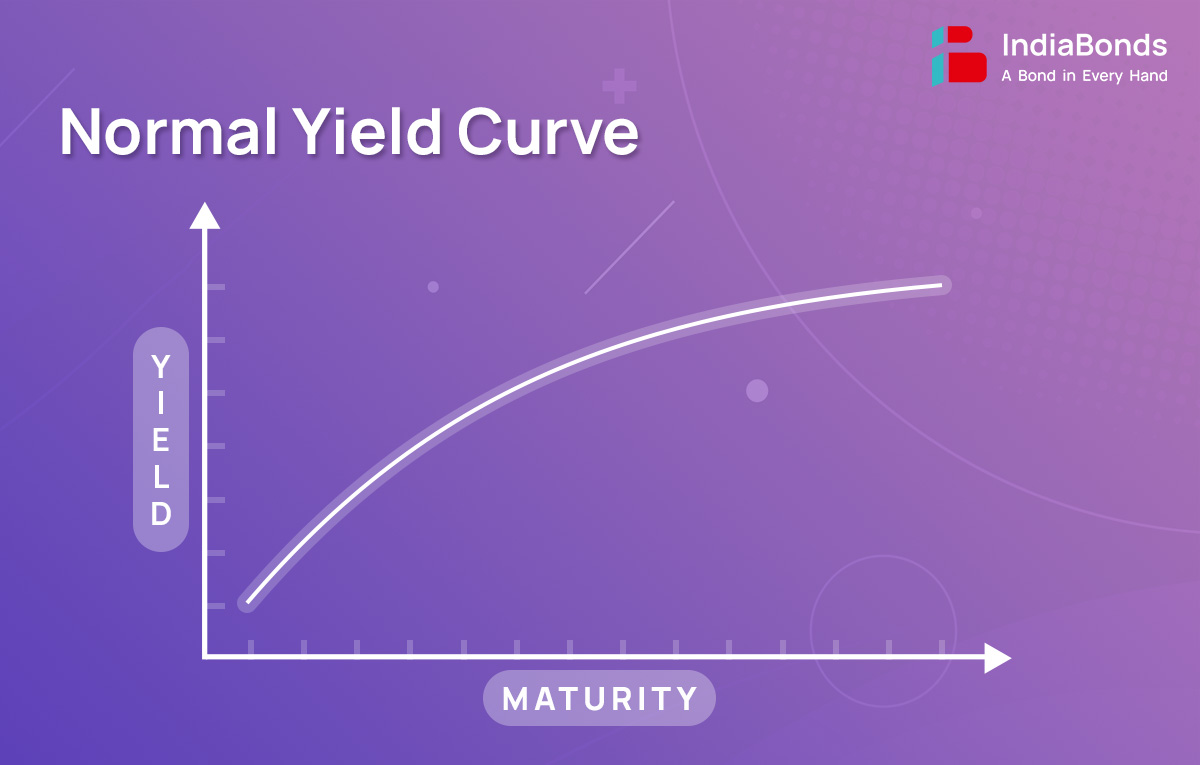
In other words, as the borrowing tenure increases, the interest rate that must be paid also increases. The reason behind this is the substantial uncertainty that comes with long-term borrowing. It is impossible to forecast what unforeseen events may occur in the next decade or two, such as the possibility of a financial crisis leading to a global economic collapse. To compensate for this uncertainty, borrowers may need to offer a higher coupon rate to attract investors who are willing to take on the risk.


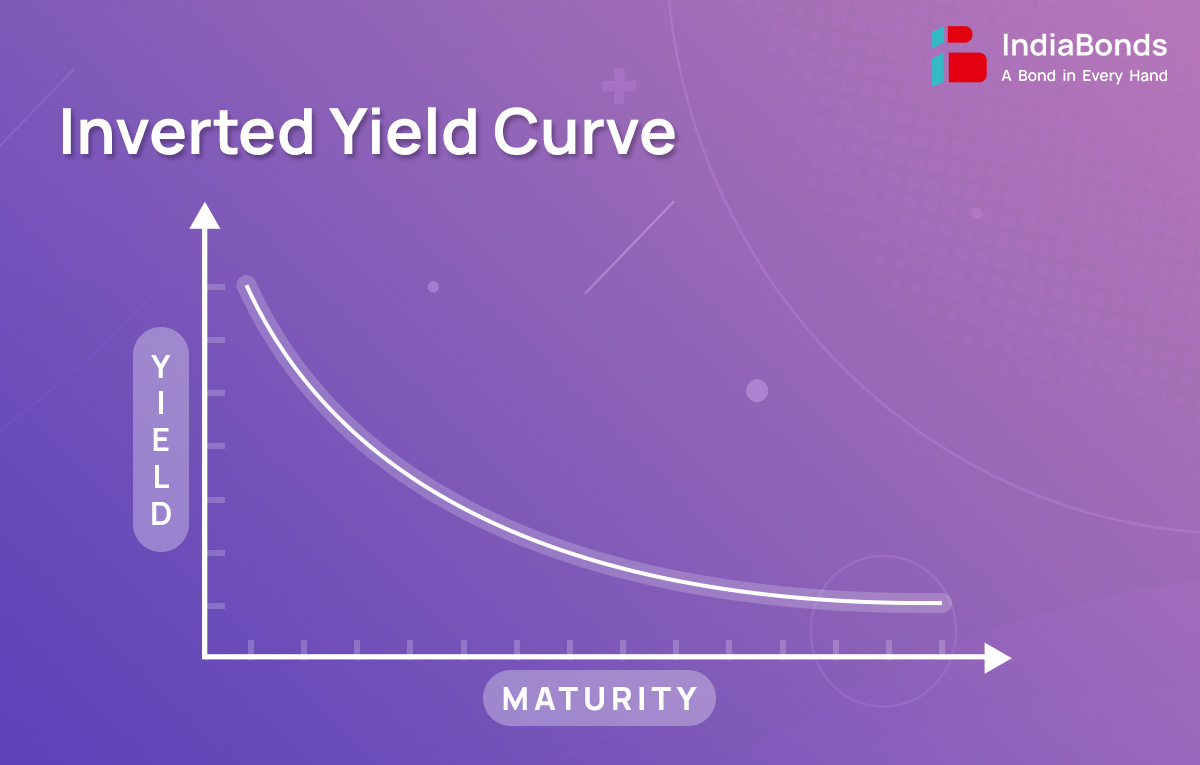
When short-term interest rates exceed long-term ones, the yield curve undergoes inversion, signaling a shift of investor funds from short-term bonds to long-term ones. This phenomenon is known as an inverted yield curve. Investors may anticipate lower interest rates in the future due to their belief that a recession is likely in the short term. As a result, they are willing to accept lower yields on longer-term bonds now in anticipation of lower interest rates in the future. This increased demand for longer-term bonds drives down their yields and causes the yield curve to invert.
When short-term interest rates become higher than long-term interest rates, it leads to an economic phenomenon known as a yield curve inversion. This makes it more expensive for businesses and individuals to borrow money for investment and expansion purposes. The higher borrowing costs may discourage businesses from making new investments and consumers from making major purchases, which can slow down economic growth. Furthermore, banks may also become reluctant to lend money, as they may be concerned about the economic outlook and the ability of borrowers to repay their loans. This can reduce the availability of credit, which can further slow down economic activity. The combination of reduced investment, consumption, and credit availability can lead to a contraction in economic activity and ultimately result in a recession.
Therefore, an inverted yield curve is considered to be a reliable predictor of economic recession, as it indicates a lack of confidence in the economy’s prospects.
Historically, inverted yield curves have preceded several recessions. For instance, before the 2008 financial crisis, the yield curve inverted in 2006. Another notable instance occurred in 2000, preceding the dot-com bubble burst. More recently, an inversion in 2019 raised concerns about a potential economic downturn.
A historical event is taking place in the US as the spread between short-term and long-term bond yields has reached its highest level. This occurrence is significant since over the past fifty years, an inverted yield curve has frequently been a precursor to an impending recession. The current inversion could be signaling a forthcoming recession, as it reflects investor pessimism about future economic conditions.
To conclude, questions on the reliability of the inverted yield curve in predicting a recession remain. However, the yield curve is a valuable tool for assessing the economy’s overall health and potential future direction. By understanding the implications of an inverted yield curve, investors can make more informed decisions, and companies can better plan their financial strategies. Ultimately, recognizing the signs of an inverted yield curve can help mitigate potential losses during economic downturns.
A, An inverted yield curve is considered a warning sign of an economic slowdown or recession, as it suggests that investors have a pessimistic outlook on the economy’s prospects.
A. The phrase “inverted yield curve” was first introduced by Campbell Harvey, a Canadian economist, in his doctoral thesis at Duke University in 1986.
A. The inverted yield curve is the most reliable indicator of a declining economic downturn. However, it can be imprecise in forecasting the recession. Sometimes, the recession might come years after an inverted yield curve. It has also been observed that a recession happens every five years.
A. According to a Deutsche Bank report, the segment of the Treasury yield curve that plots the two-year and 10-year yields has experienced the longest inversion since July 2022. The previous record was an inversion lasting 624 days, from August 1978. As of now, the yield curve has been continuously inverted since July 5, 2022, surpassing the 1978 record (source: Deutsche Bank)
A. The slope of an inverted yield curve is downward, indicating that short-term interest rates are higher than long-term rates.
A. If the yield curve is downward sloping, the yield to maturity on long-term bonds will be lower than the yield to maturity on short-term bonds.
A. Yes, historically, an inverted yield curve has been a reliable predictor of recessions, signaling economic downturns in advance. However, the timing of the recession following the inversion can vary.
Disclaimer: Investments in debt securities/ municipal debt securities/ securitised debt instruments are subject to risks including delay and/ or default in payment. Read all the offer related documents carefully.


